Large Labor Model · a data deep-dive
Every Job Is Two Jobs
Machines are moving toward mastery of knowledge work. Much of physical work still escapes them, for now. A model of how tomorrow's work might work.
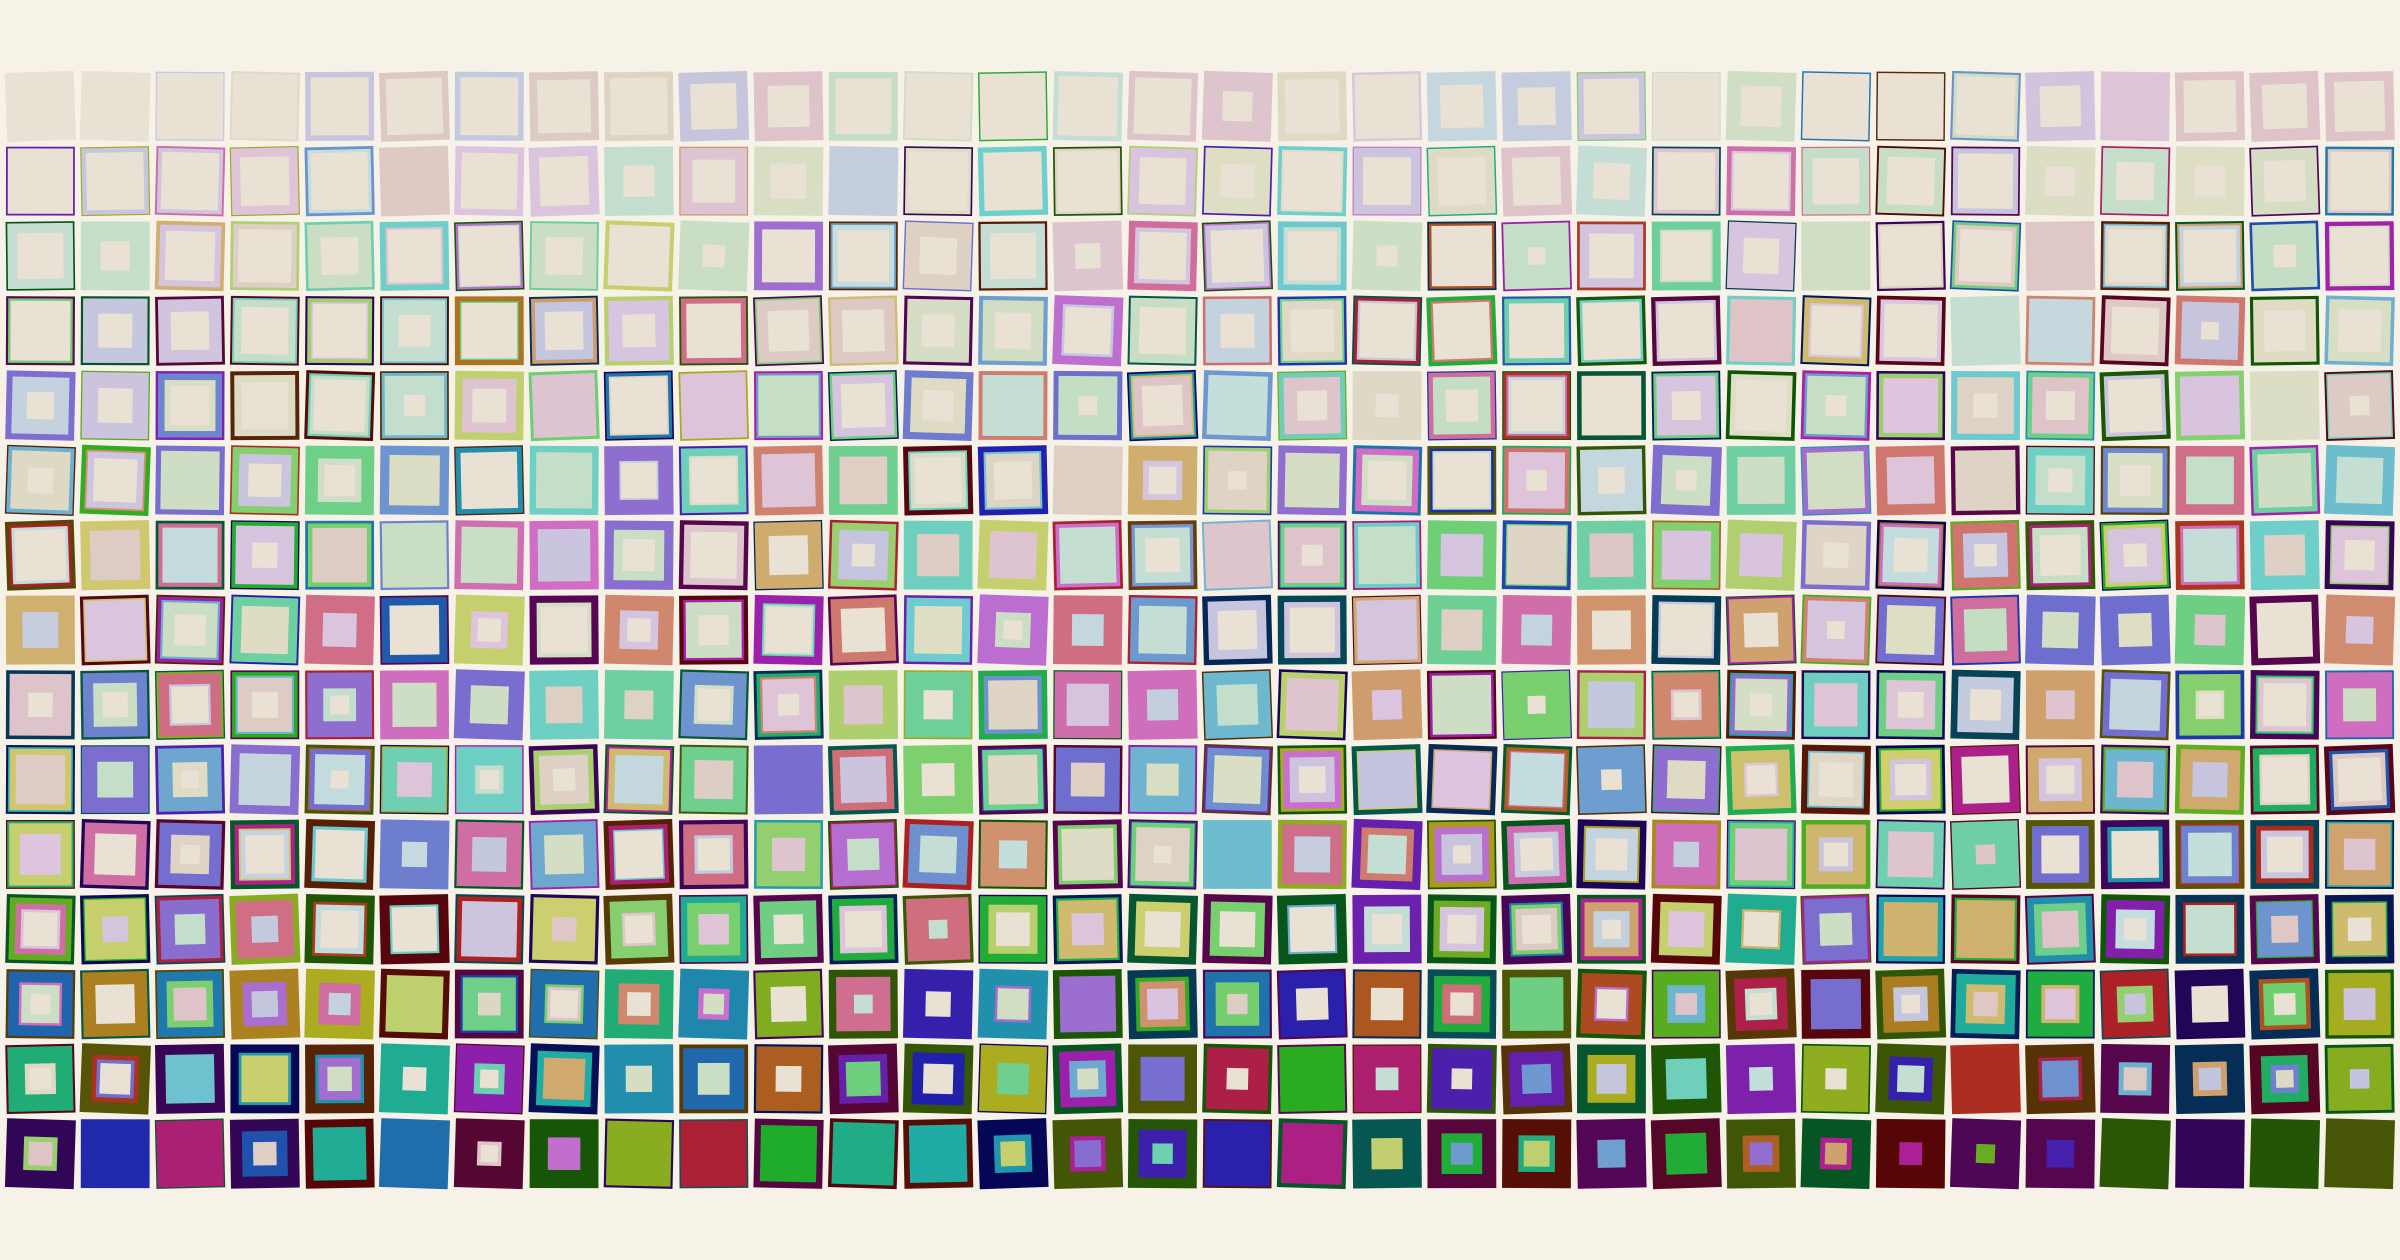
At some point this morning, a nurse cleaned and dressed a wound. It is delicate work. The judgment lives in her fingertips, in the look of skin, in a patient who flinches or doesn't. None of it repeats. An hour earlier, at a station down the hall, the same nurse wrote up a patient's health-education plan: structured, documented, screen-shaped work. The kind software has learned to do startlingly well.
Will AI take her job? Three years of headlines have trained everyone to ask some version of that question. Answers vary wildly, depending largely on your proclivity for new technology: forty-seven percent of jobs at risk (Oxford, 2013). Three hundred million exposed (Goldman Sachs, 2023). Barely any effect at all (Acemoglu, 2024). At most one of those can be right, and the quarrel is not really about the technology — it is about the unit. A job title is a bundle of unlike hours, and a question aimed at the bundle averages the nurse's wound care into her paperwork. Aim at the hours instead, one at a time, and answers start coming back.
That is what the Large Labor Model attempts. A public dataset and atlas that takes 480 occupations apart into 4,811 tasks — the things working people actually spend hours on — and asks of each one a question small enough to answer: how much of this can today's machines do? Each task gets a score between 0 and 1, from no machine on Earth meaningfully helps to a machine could carry it alone, scored for each year from 1970 to 2026 against the record of what has actually shipped — benchmarks, deployed products, robots installed and working — and projected fifteen years beyond.
On that scale, this year, the nurse's health-education plan scores 0.67: a machine can already do most of that work, with a human checking it. The wound scores 0.008. Same person, same shift, same job title. One of her hours has effectively been learned by machines. The other is, to a machine, still almost perfectly opaque.
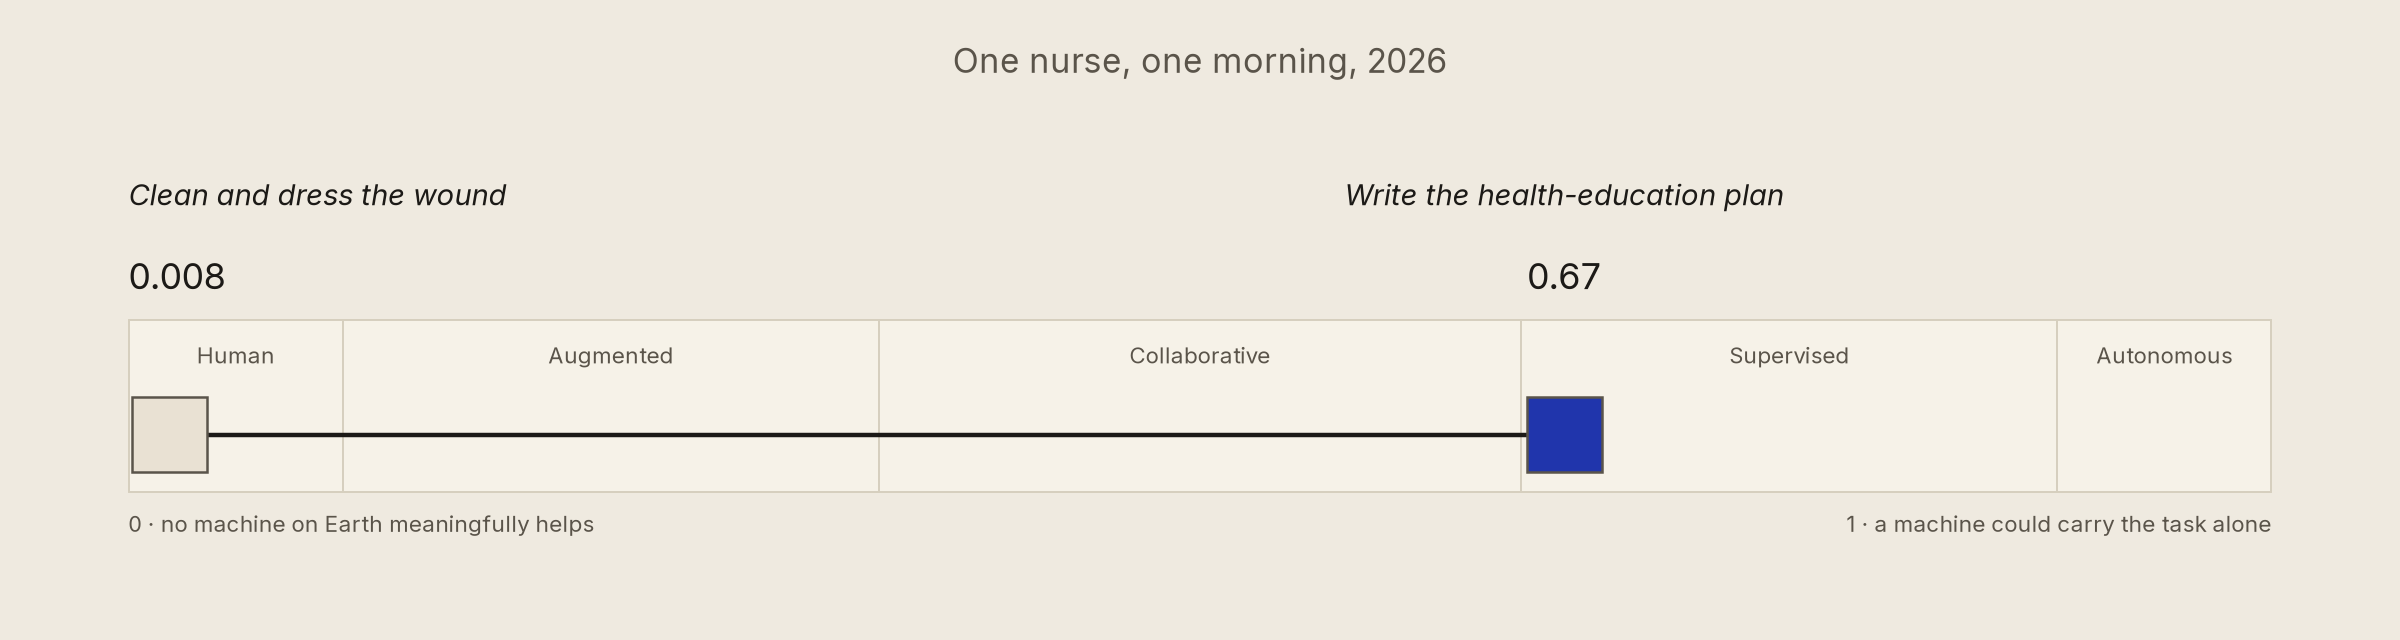
Run that split across all 480 occupations, every task weighted by the hours it takes, and her morning turns out to be the general condition. Every job divides into the hours machines have absorbed or could absorb, and the hours they cannot remotely do. The line does not run between occupations, between blue collar and white. It runs through them, through nearly every working day on Earth. Every job is two jobs.
One side of that line will not hold still. In the summer of 2024, the most advanced AI systems in the world could not reliably count the r's in strawberry; the failure was a running joke. By 2025 they were doing cited research and supervised coding for paying customers. This spring, a 23-year-old amateur iterating with one solved a problem that had stood open for sixty years. In July, the number theorist Levent Alpöge, working with a model, produced a counterexample to the Jacobian conjecture, open since 1939. Two summers, joke to theorem.
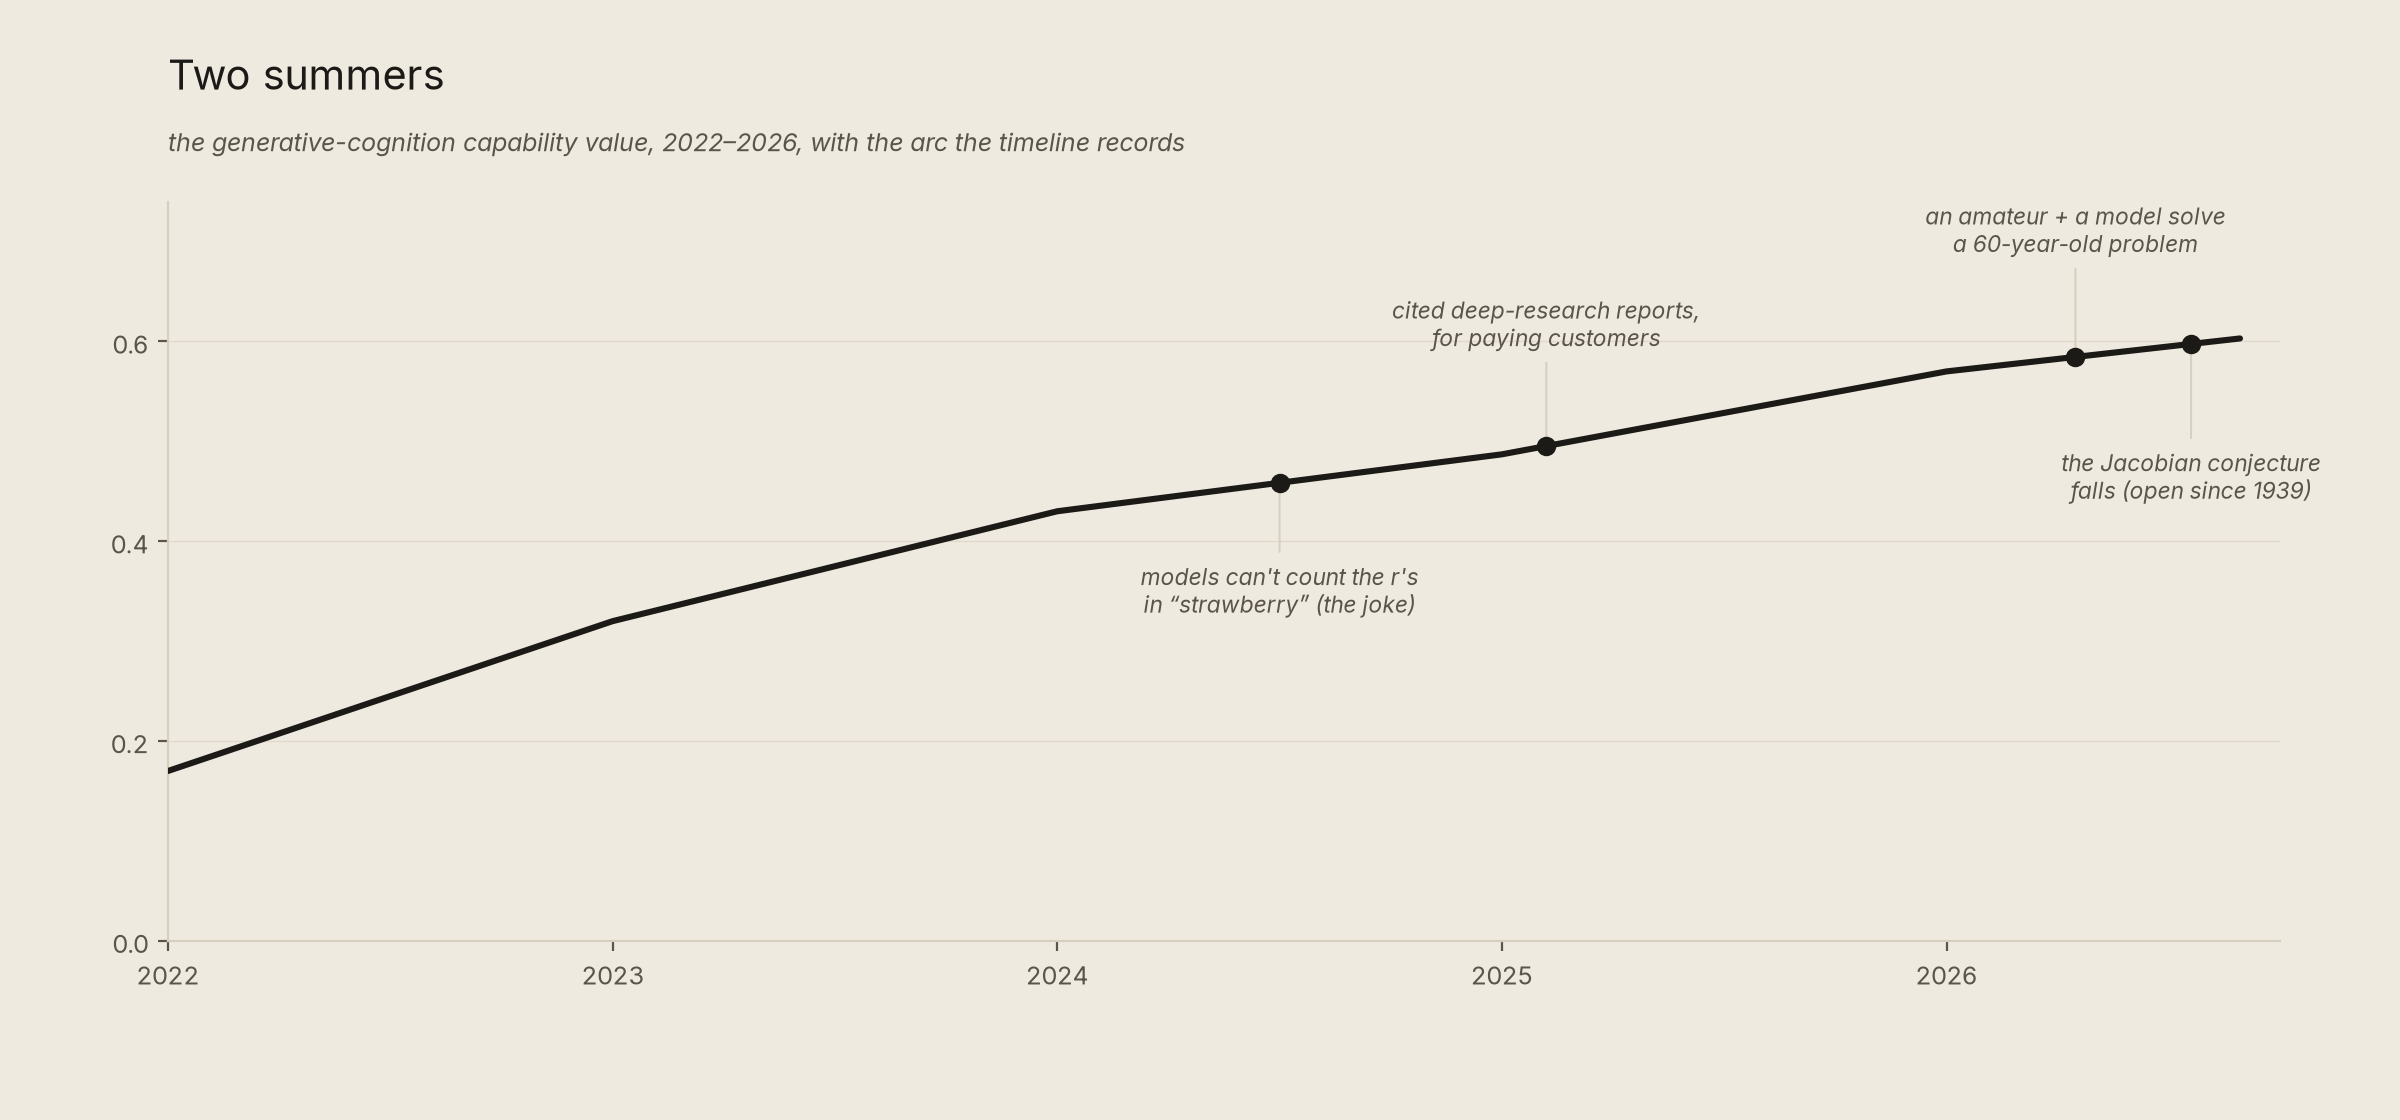
But capability is general and work is specific. A rising curve lands on a job one task at a time, which is why the nurse's plan fell and her wound care did not. And a curve says nothing about employment. Technical replaceability is not replacement. Replaceability asks whether the technology exists, works on the task, and can be bought. Replacement is what happens to jobs, and it arrives years later, through adoption, regulation, and human preference. Most of the contradiction among the forecasts comes from blurring those two questions; keeping them apart is why the model exists.
I
A map you can argue with
My first decision was taxonomic. Official statistics group work by industry — ISIC sections lettered A through S — which is how economies see work. People do not experience work as a sector. So I regrouped the sections into thirteen territories of human work, each named for what the people in it do: feeding and fueling, keeping people alive and well, deciding what to do, making the culture. The statistics stay anchored underneath. What changes is that labor becomes activity and observable movement.

The territories where the most people work run overwhelmingly on unstructured physical time: Land & Sea, Maintaining & Fixing, and Building Things all spend roughly three-quarters of their hours there. The territories that run on cognition are, by world standards, small. A taxonomy is a lens. This one is ground so that the vague question — what can machines do to work? — resolves into a precise one: which kind of time does each territory run on? And that question has answers.
Every task carries three properties: which of six machine capabilities the work leans on, from routine cognition to unstructured physical work; how difficult it is; and how many working hours it claims. Behind the tasks sits a registry of several thousand sources — task statements, employment series, robot-density counts, deployment reports. The model calculates technical replaceability like this:
r(occupation, year) = 100 · Σ time_weight · σ(8 · (capability[vector][year] − difficulty)) ÷ Σ time_weight
Compare the year's machine capability with each task's difficulty; the logistic σ turns the gap into partial credit; weight by working time and sum — for every year from 1970 to 2041. The odd endpoint is deliberate: 2041 is now plus fifteen, past which projection would shade into speculation. Five tiers give the numbers words: Human (a machine makes no meaningful contribution yet), Augmented (a machine makes you faster), Collaborative (a machine can do about half), Supervised (a machine does most of it; you check the work), Autonomous (end to end, no human needed).
The atlas reaches further back than the scores do. Open the map in 1800 and the thirteen territories collapse into three masses — the land, industry, services — which split apart as the modern division of labor emerges; run time forward and exposure migrates across them. Labor, at work.
II
Where the line runs
Score the 480 occupations at 2026 and you'll find they spread across nearly the whole scale.
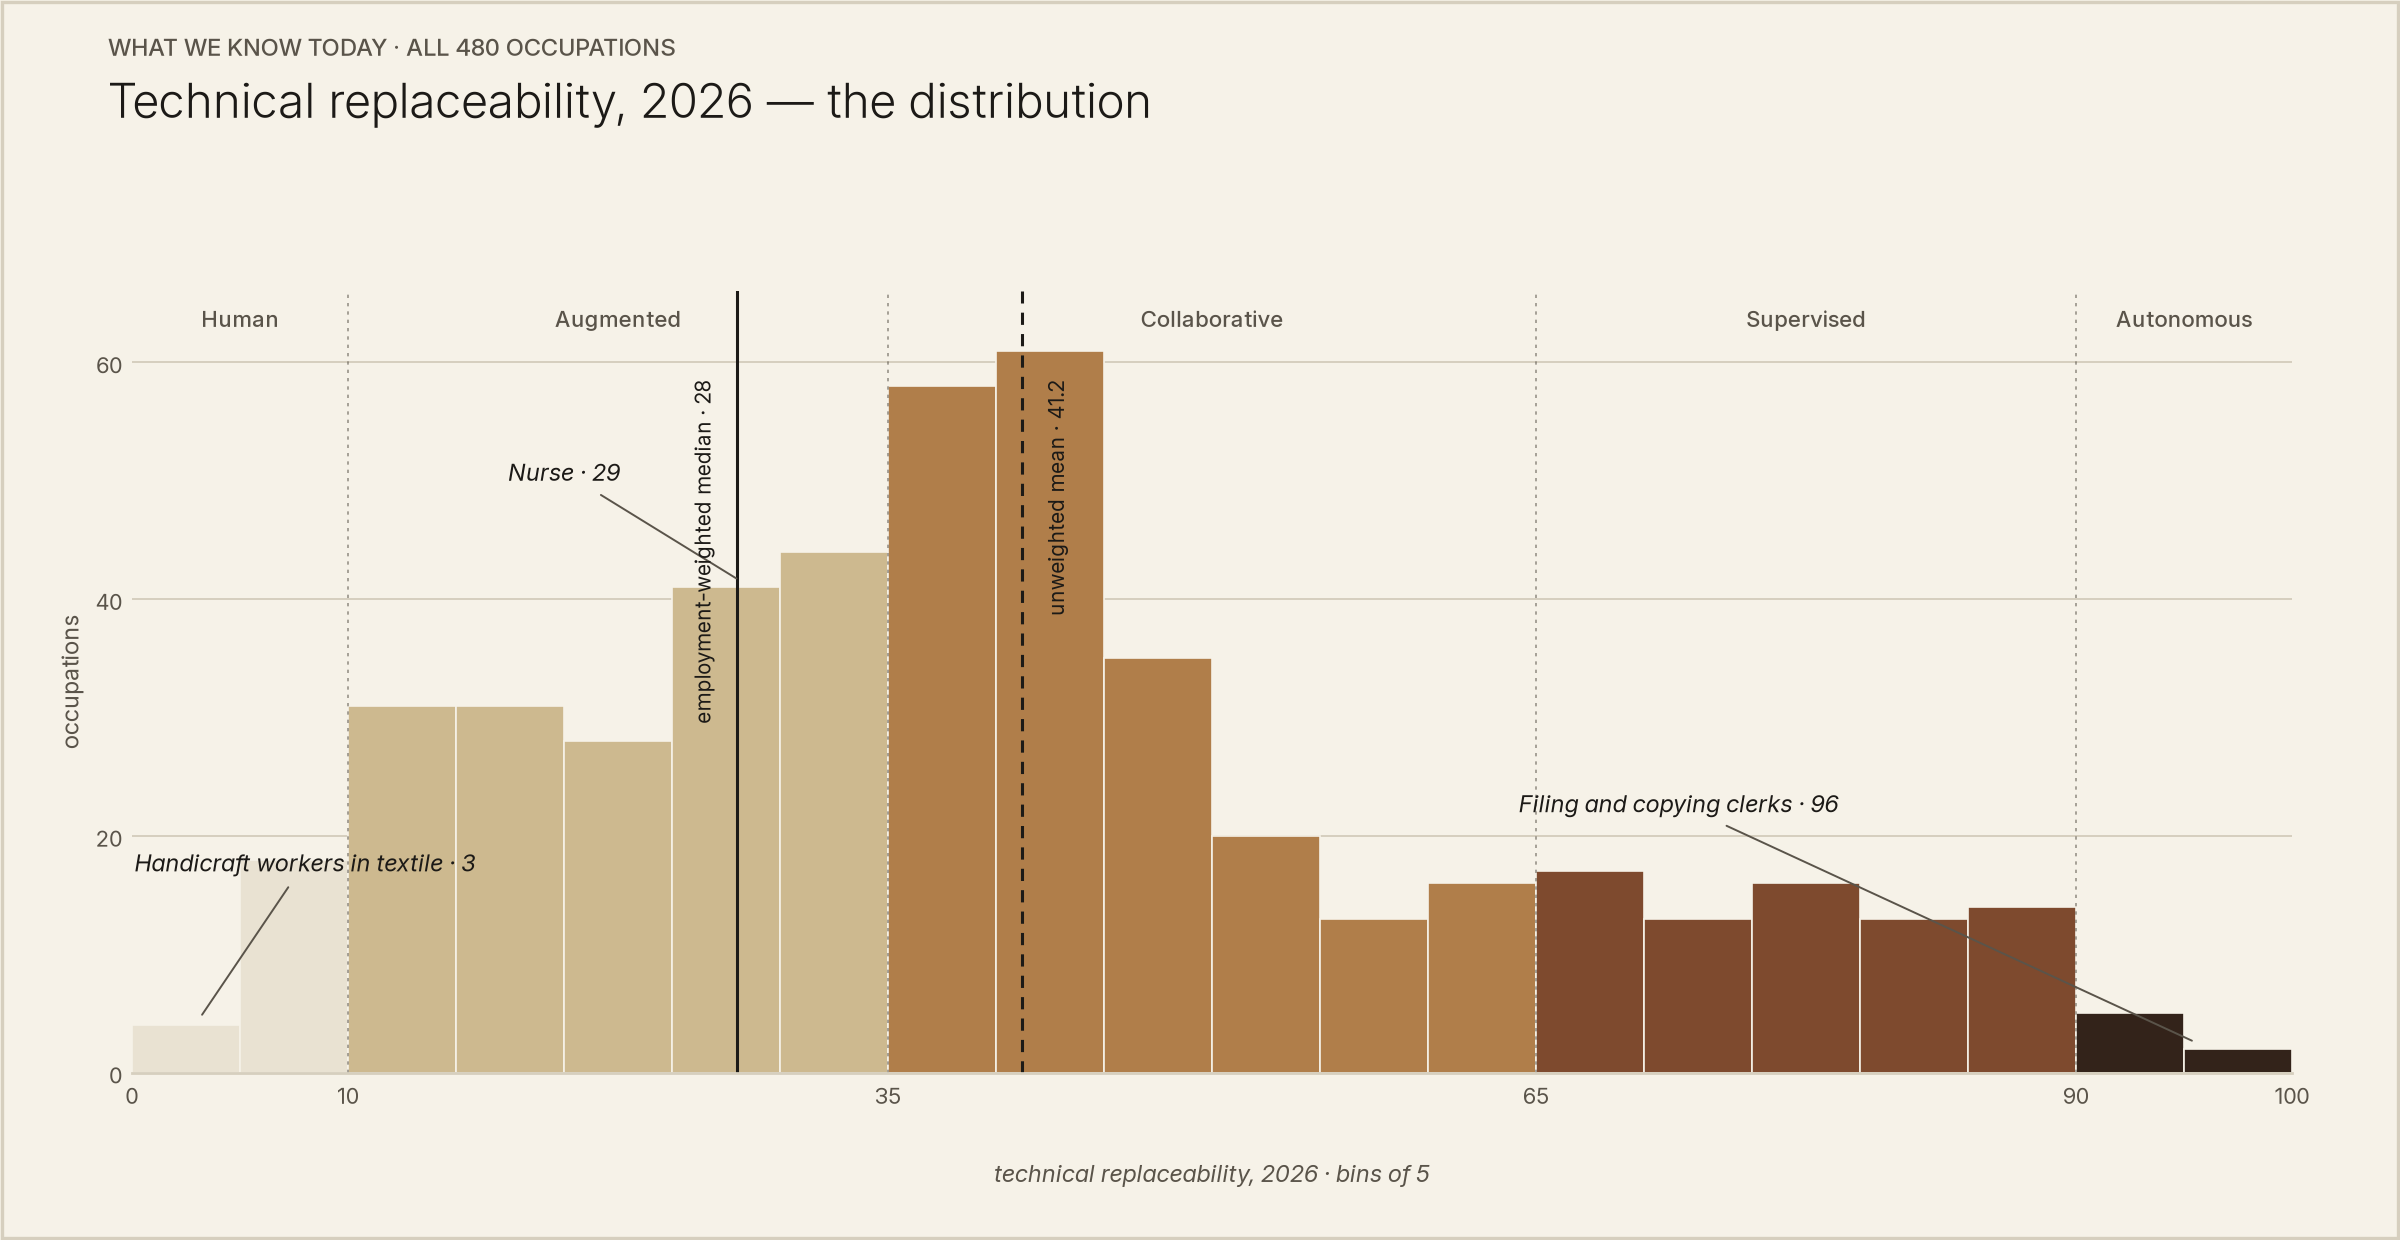
At the top, jobs made almost entirely of routine screen work. At the bottom, jobs made almost entirely of hands. Neither tail is a prophecy — a bottom-tier score describes machines, not the future of those jobs — but between the tails the whole labor market arranges itself by one question: how many of your hours are the learnable kind?
When we weight each occupation by how many people actually do it, the picture changes. The median worker's job scores a third lower than the average occupation, because the world's employment is concentrated in physical work. Job titles cluster around offices; working time clusters around hands.
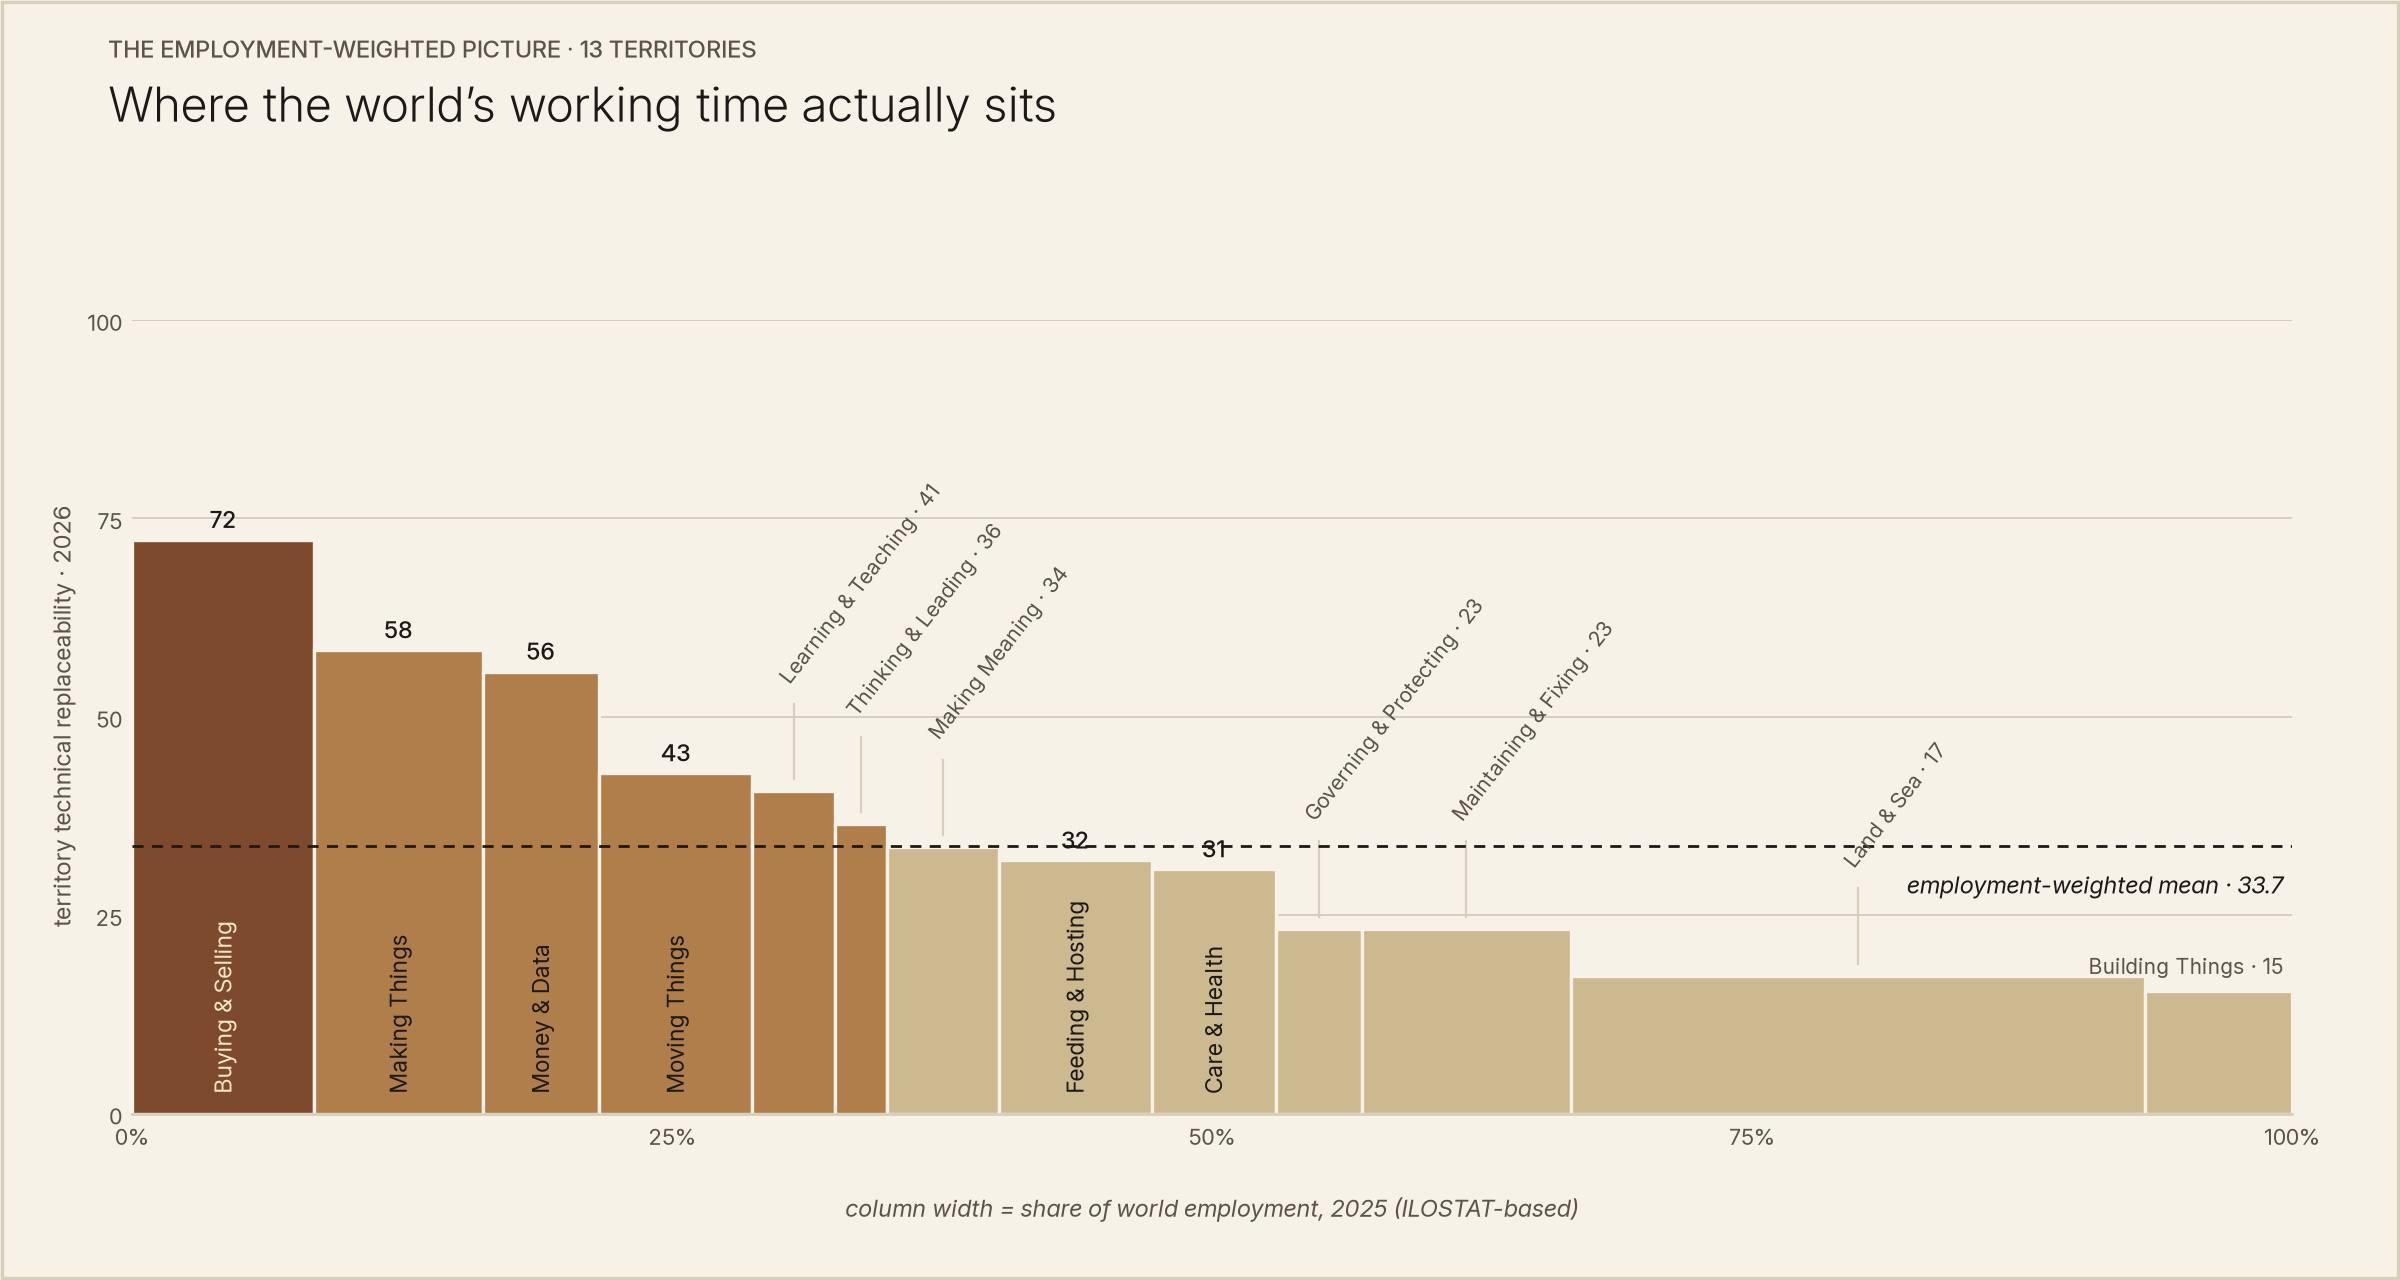
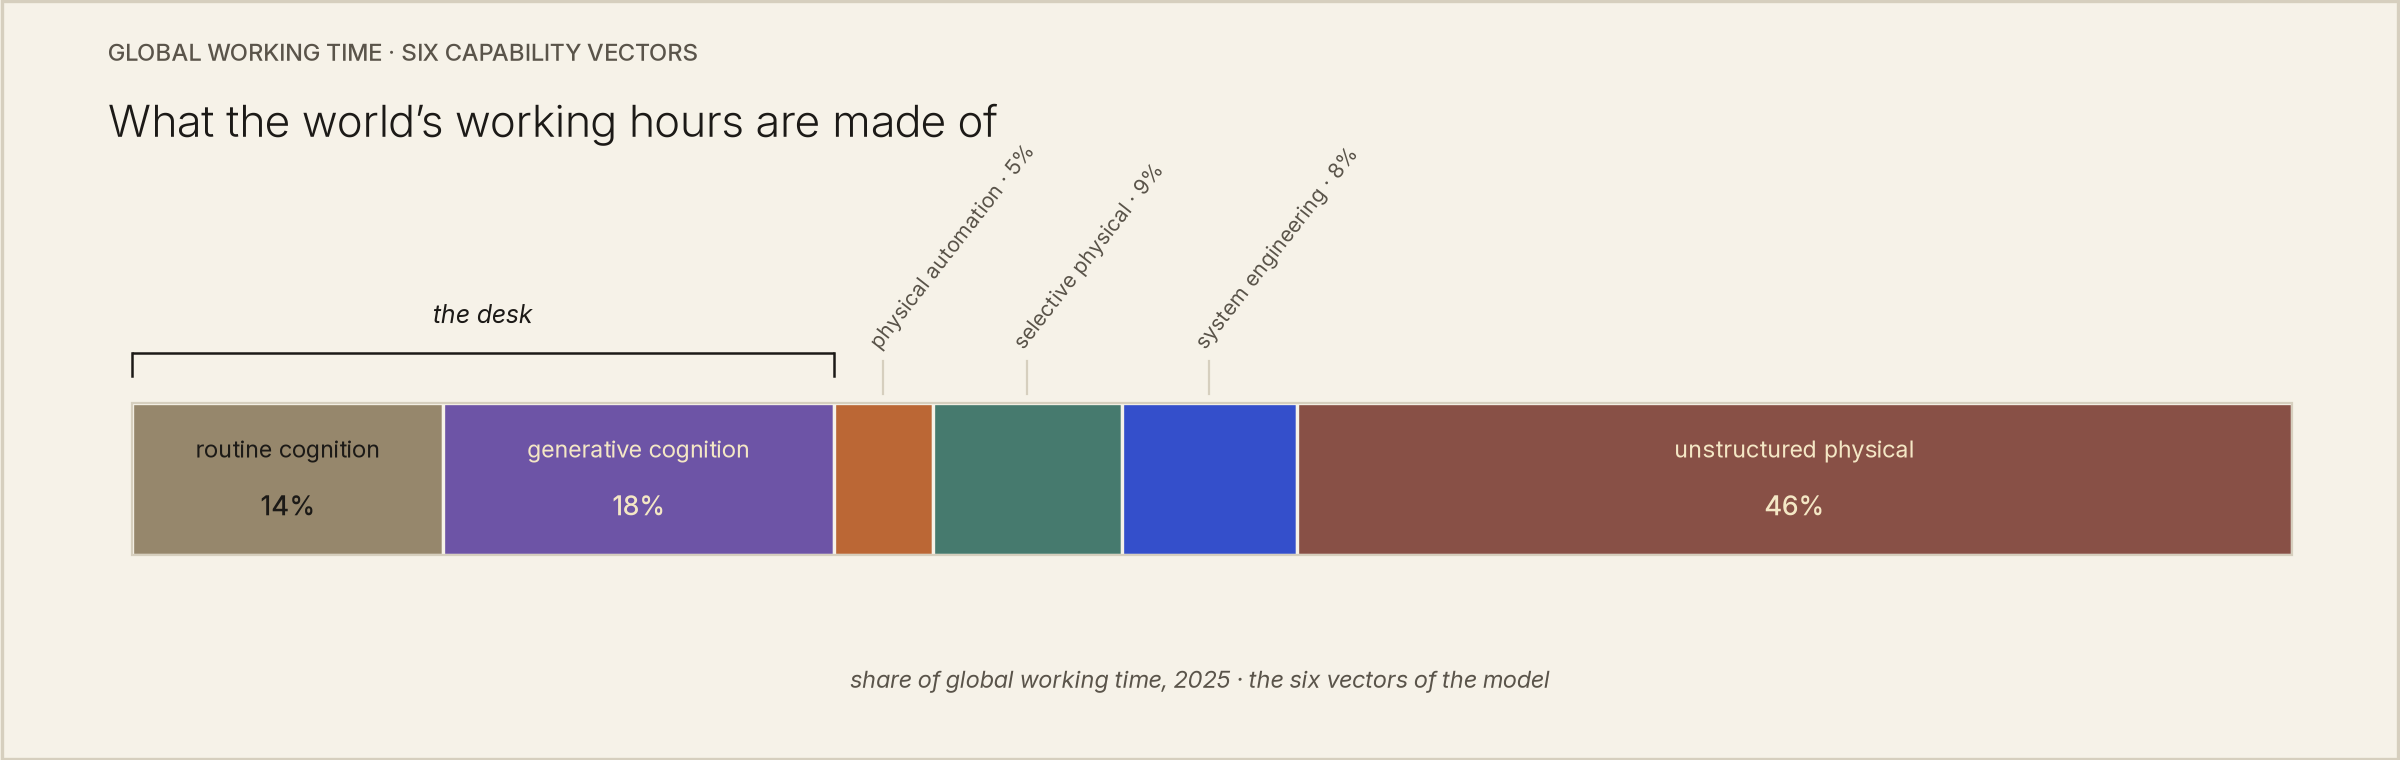
The tall columns are narrow, and the widest column is short. Add the two cognitive stripes together and you have the desk — our AI drama's stage — about a third of the world's working hours. Nearly half is unstructured physical work, the vector where machines remain weakest — less than half the next-lowest dial. And still: a quarter of the world's working time already sits on tasks the frontier has crossed. Both things are true at once, yet the public debate treats them as a choice.
One Nurse, eleven tasks
Let's take another look at our nurse.
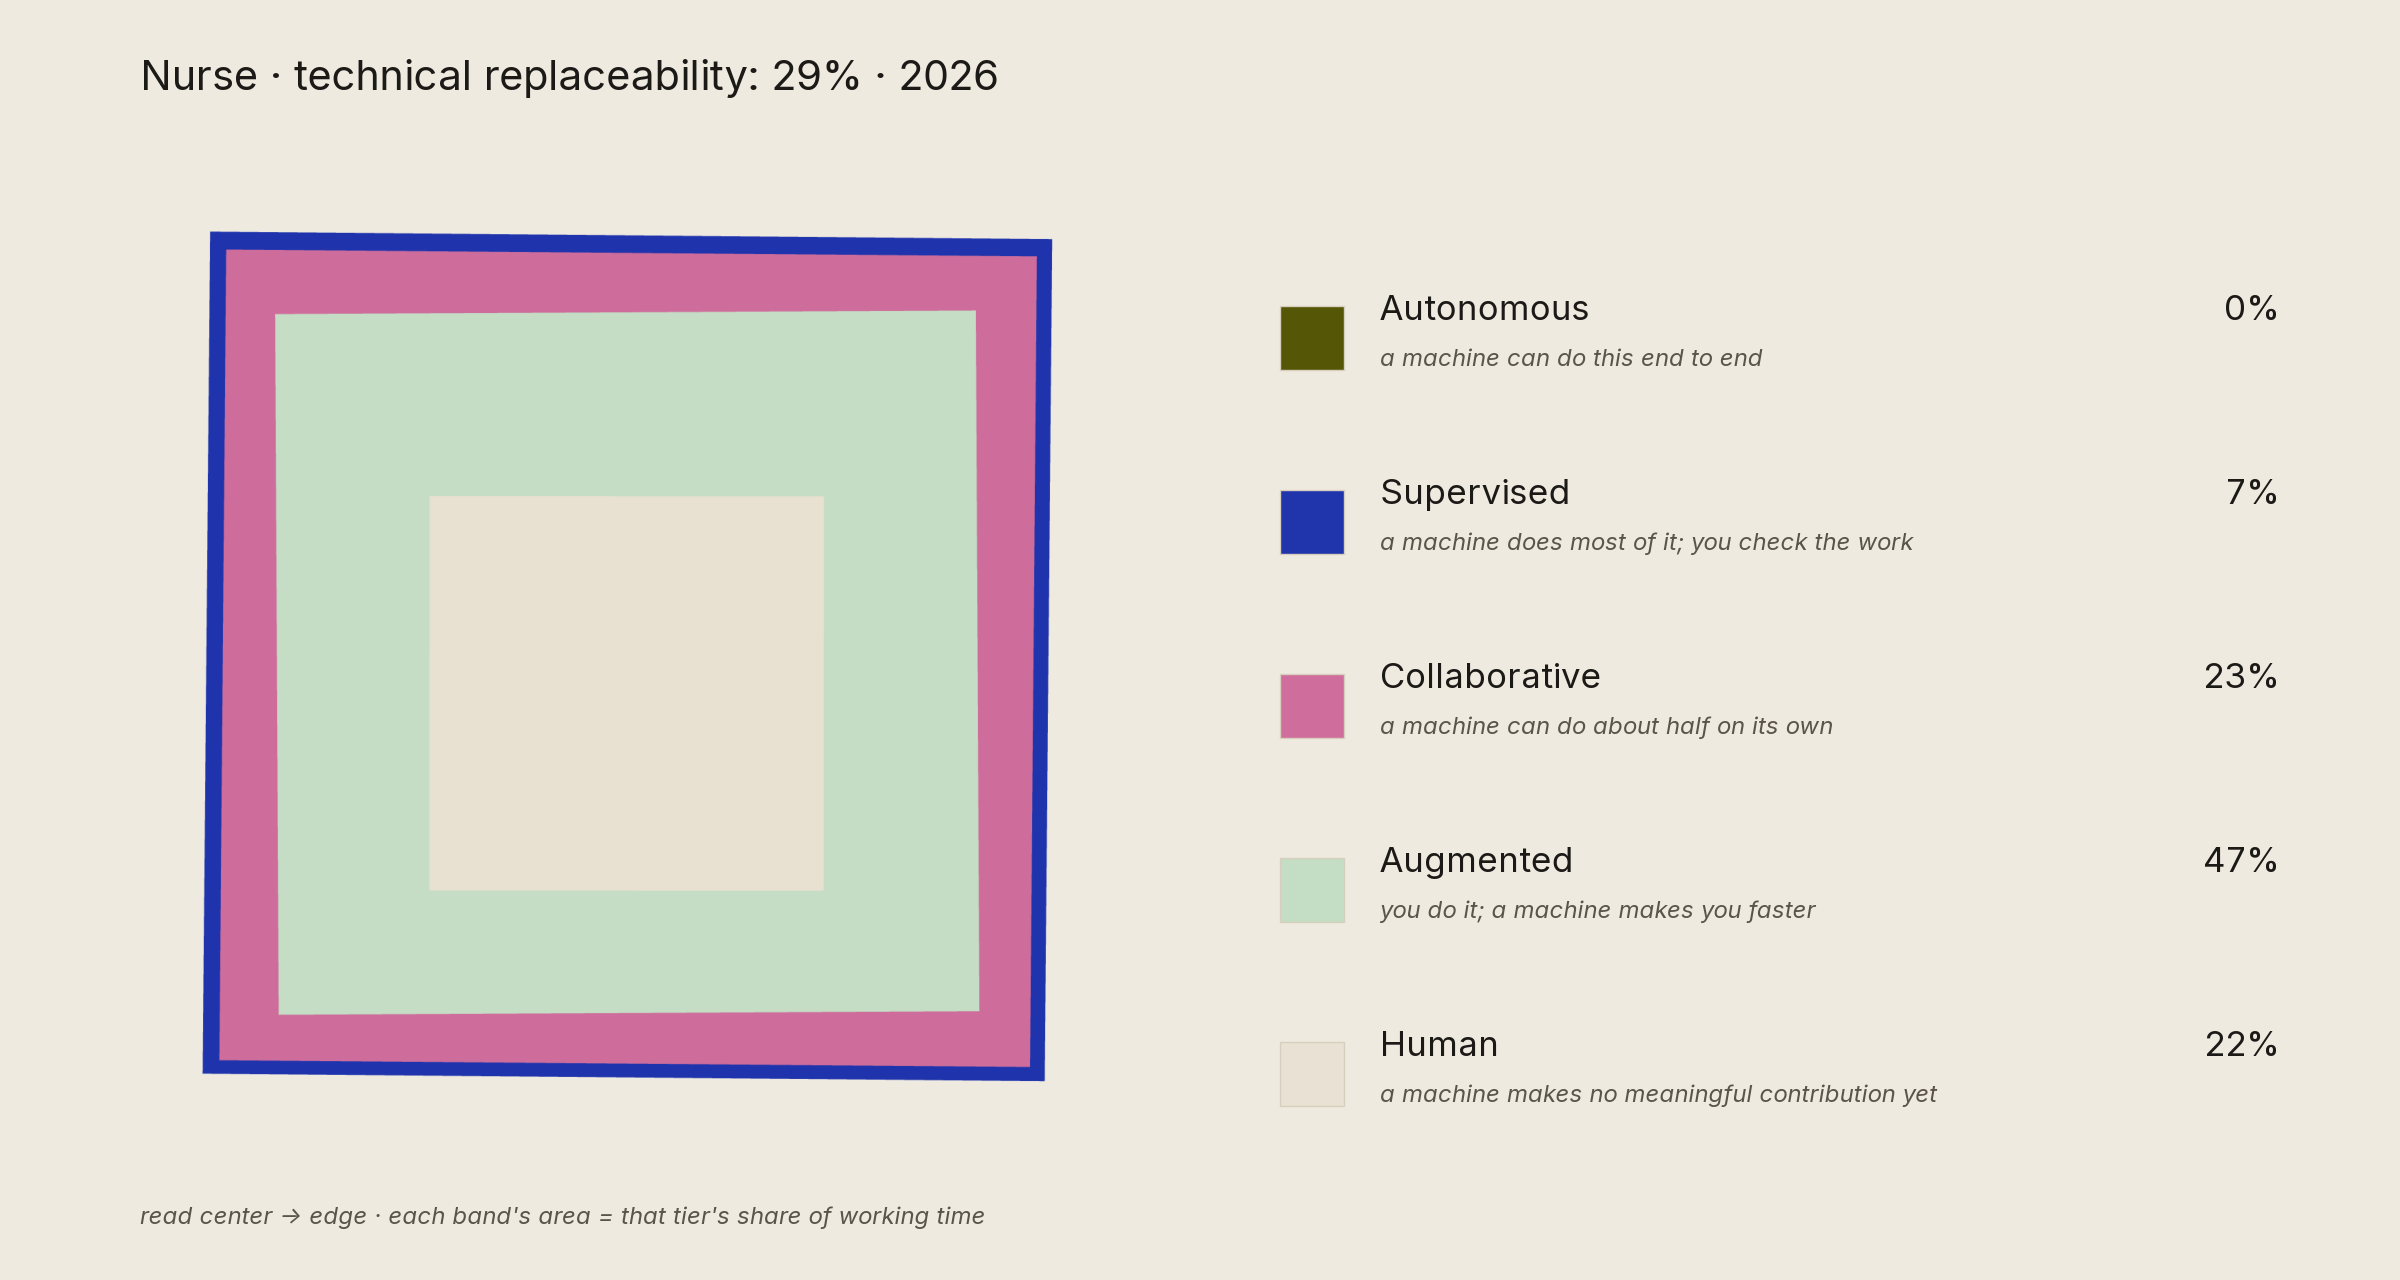
Eleven tasks: seven cognitive, three embodied, one coordinating. The machine earns its credit task by task — most on planning health education, the 0.67 from her morning; almost none on wound care, the 0.008; partial credit on everything between, from treatment plans to answering a frightened patient's questions. Weight by hours and sum: 29%. But the number is a compression. What the table shows is her morning again, formalized: the paperwork partially ceded, the judgment contested, the hands untouched. A Nurse in 2026 is, in the model's terms, a knowledge worker at the desk and an artisan at the bedside.
Nurse · eleven tasks · 2026

III
How fast the line moves
Everything forward-looking in the dataset reduces to six capability curves and their uncertainty bands. Under the central case, the next fifteen years belong to the vectors that are weakest today.
The six dials · 1970–2041, low–high band, mid line
What machines can do, by kind of work

Unstructured physical capability — the wound, the crawlspace, the field — more than quadruples in the central case. Or it barely improves. Or it is essentially solved. That is the width of the evidence on one question: whether useful machine hands arrive at scale. Nearly half the world's working time waits on exactly that, so most of the model's forward uncertainty is that wager. The desk was software's problem; the world is hardware's. Chatbot and "agentic" progress, measured weekly in every feed, mostly moves the third of working time that is cognitive. The rest moves when machines can work in places that don't repeat.
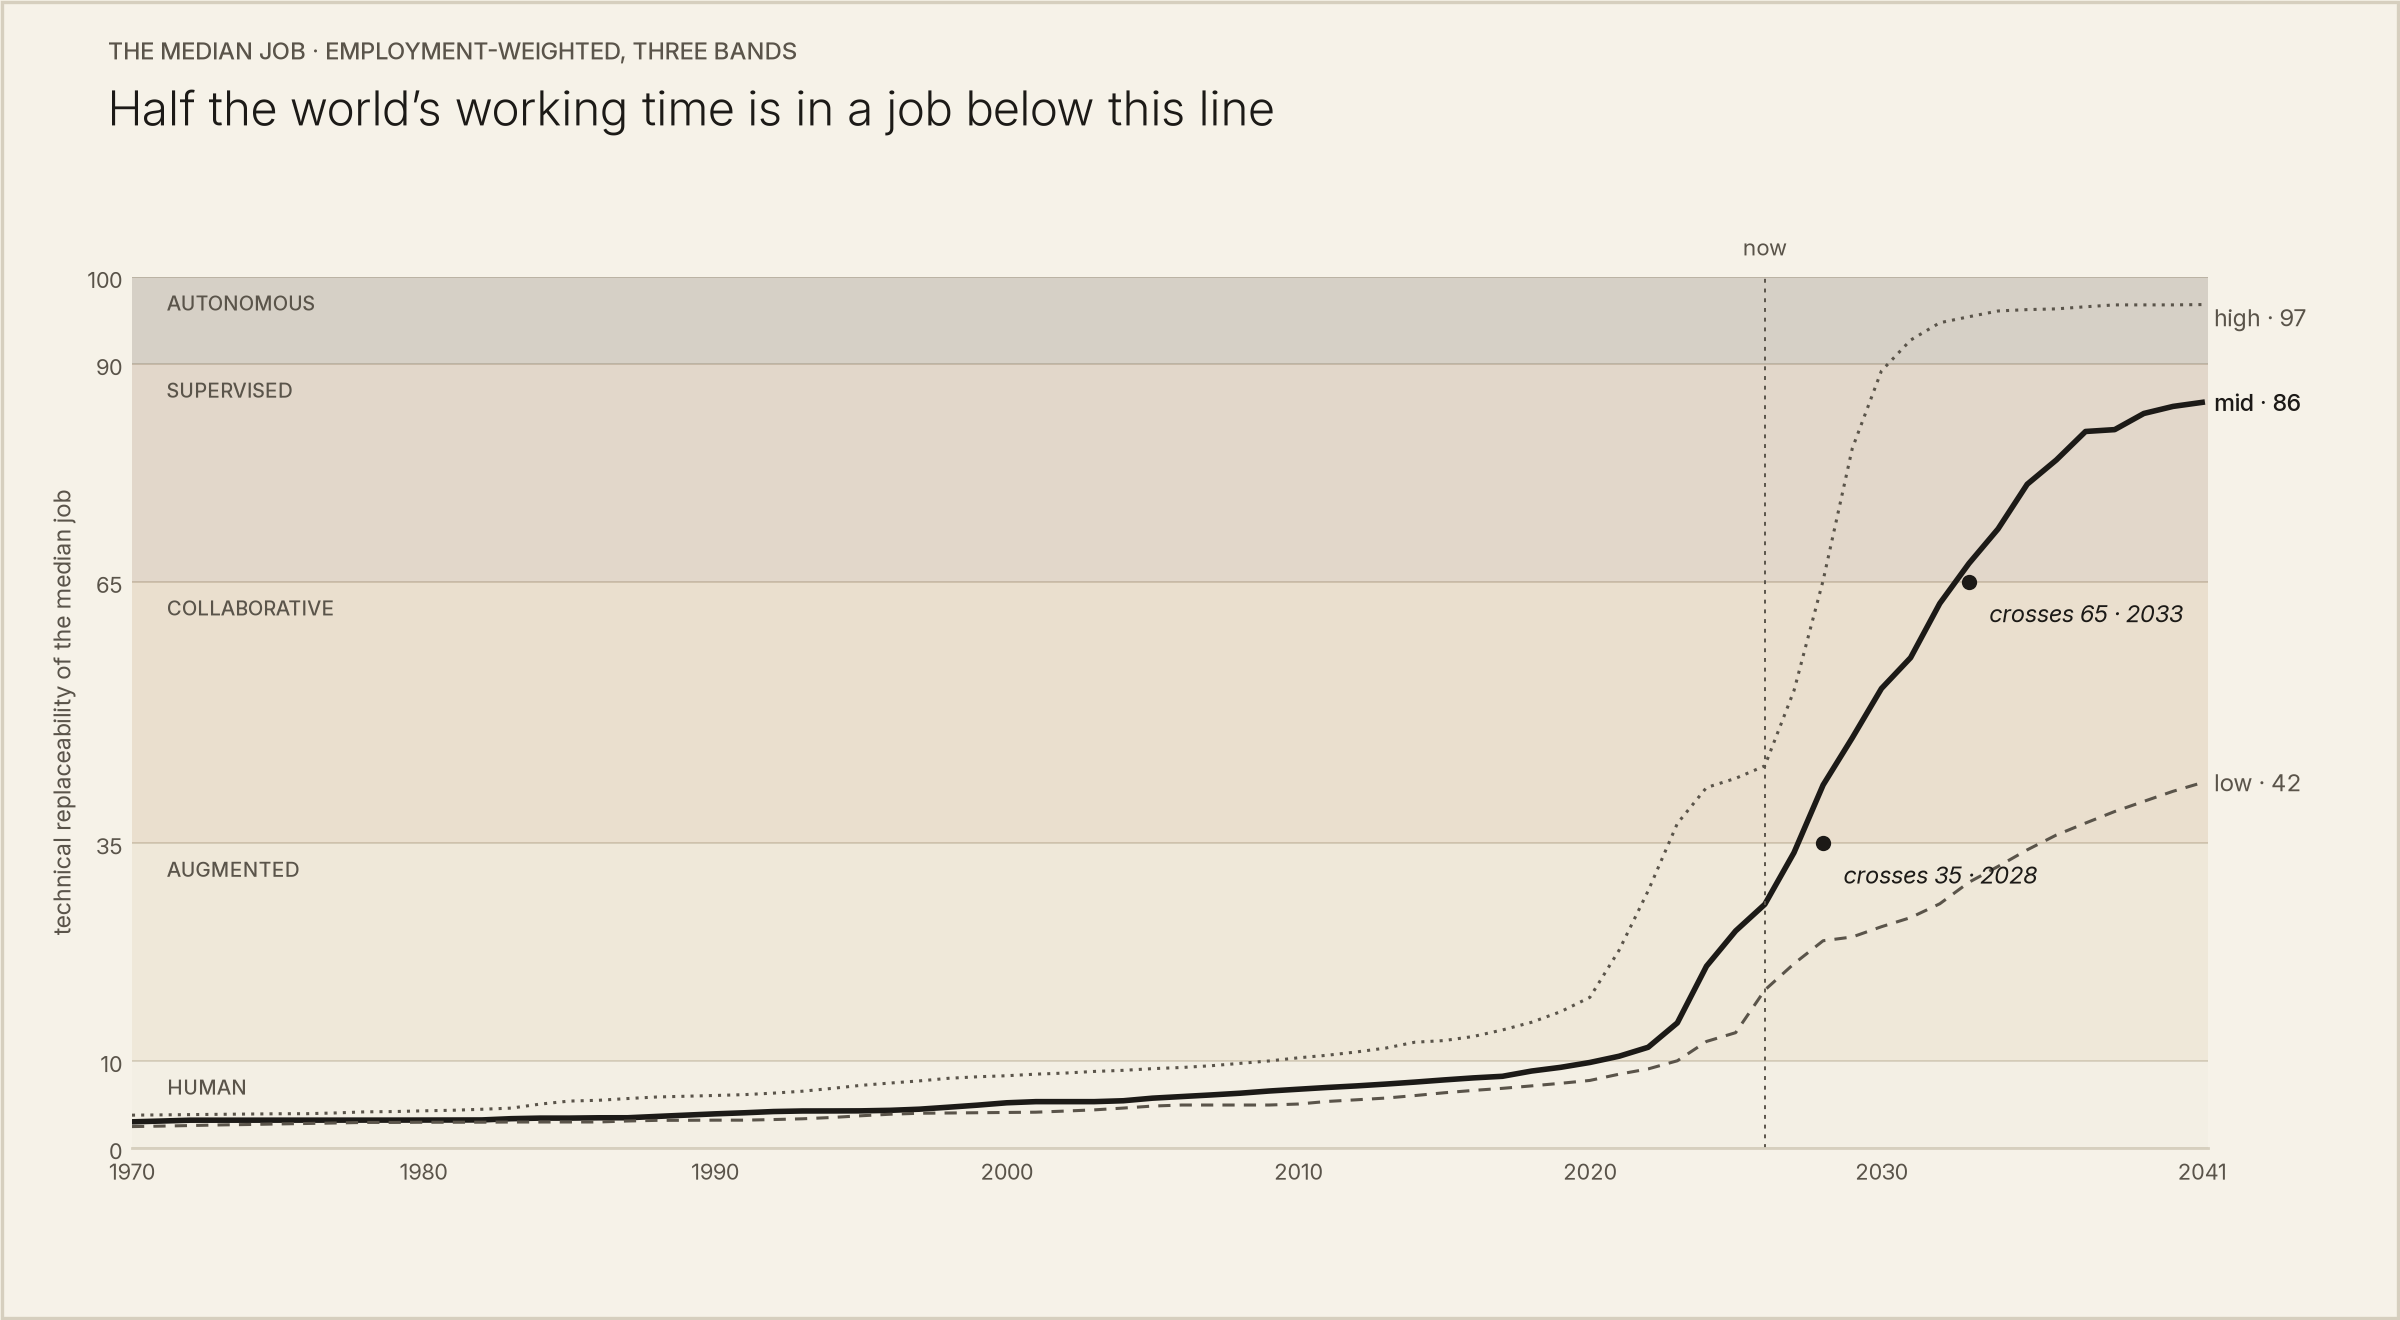
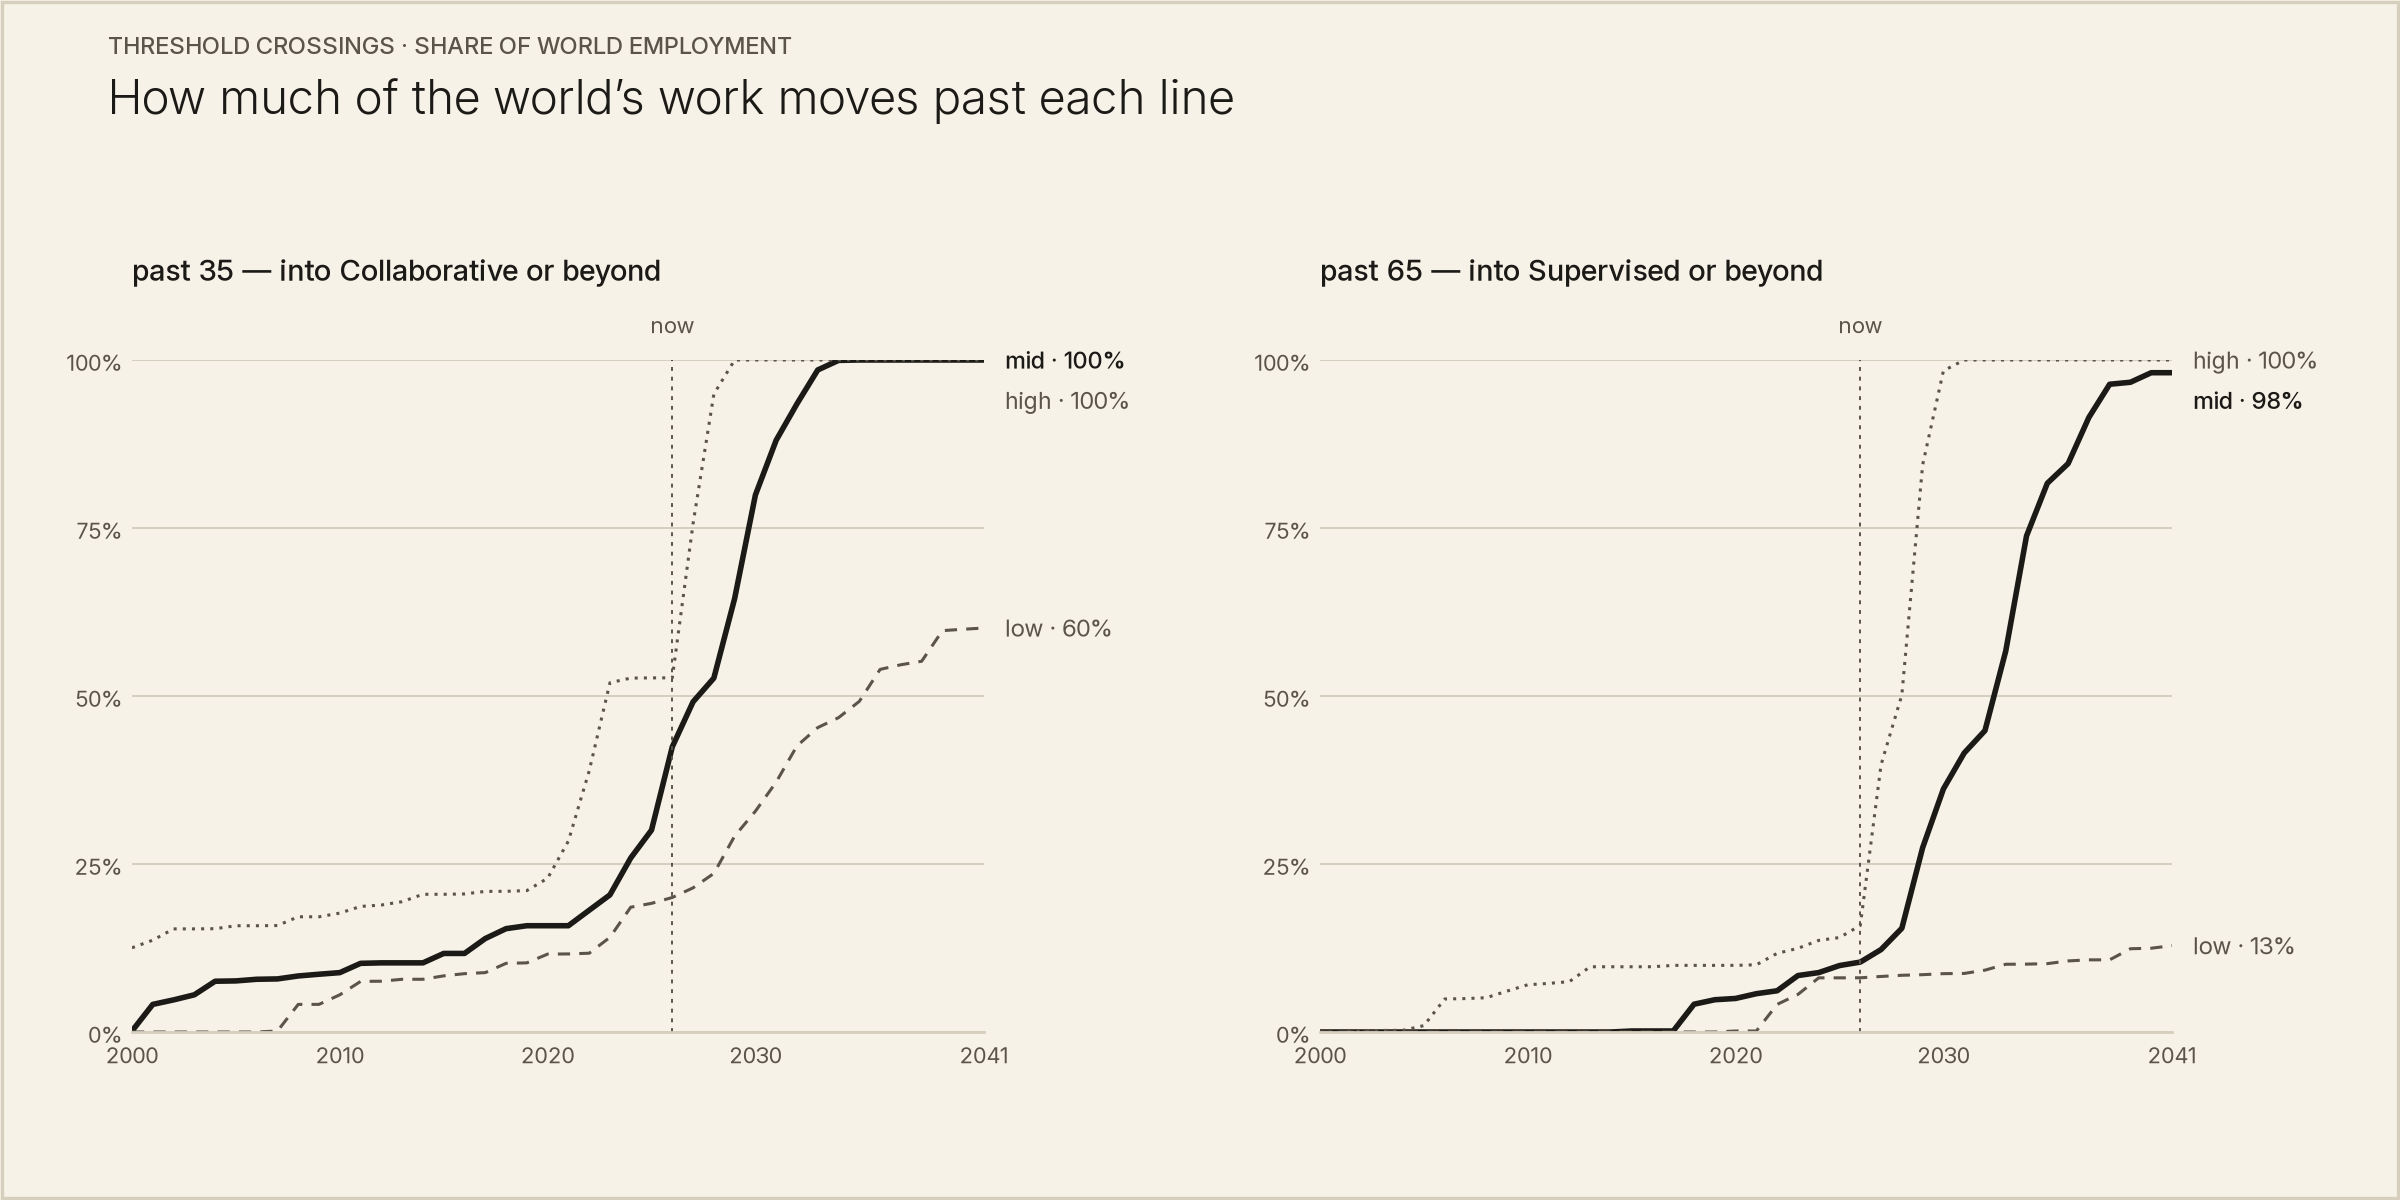
In the model's central case, the median job crosses the Collaborative line — machines able to do about half — in 2028, and the Supervised line in 2033. If we run the same arithmetic across all of world employment, the futures refuse to average: by 2041, the share of working people past that Supervised line is thirteen percent, ninety-eight, or one hundred, depending on the band. The forecasts do not narrow as they leave the present. They fork on the hardware question.
The same arithmetic redraws the territory map. Through the software decades, screen-heavy Money & Data pulled away from hands-heavy Care & Health; the gap peaks around 2028, then closes through 2041 as clerical exposure saturates and the physical vectors begin to move. The territories that look untouched today are precisely the ones riding on that question; their forward curves deserve the least confidence. And if the model's projections approximate machine progress, the 2028 crest may be the most consequential date in the dataset: the moment the story stops being about the desk.
Thirteen territories · mid band, 1970–2041
Money & Data pulls away, then the field closes in
hover or tap a curve

This is not an employment forecast. Replaceability converts to modeled replacement through a separate, deliberately skeptical formula — steep discounts for adoption lag, regulation, human preference, hardware dependence — and under the central case the two numbers sit sixty points apart by 2041. That gap marks the model's limit: the technical frontier is computable from task lists and capability curves, while the social absorption of it can only be modeled.
2041
Care & Health · the mid band · thirty-one occupations

In January, Anthropic's chief executive, Dario Amodei, argued that AI could displace half of all entry-level white-collar jobs within one to five years, even as it accelerates economic growth — and, asked whether any of that is visible in the labor data yet, agreed that it likely is not. In this dataset's terms, the claim runs the two numbers together: a replacement forecast on a replaceability clock, one horizon where the model holds three. But the urgency survives the sorting, and it is not his alone: Google DeepMind's Demis Hassabis expects a change "10 times bigger than the Industrial Revolution, and maybe 10 times faster." The harm depends on that speed, on how much faster the frontier moves than labor markets and institutions can adjust.
IV
The mirror
Today's emails draft themselves beautifully. The desk's numbers are the highest on the map and still climbing. What the data changes is the size of the question. Whether machines take jobs can be answered only in vague hypotheticals. The right measurement lives inside each job: where the line between the two kinds of tasks runs, and how fast it is moving.
Somewhere in the 480 is the job you do, or the one you did before, or the one you are deciding about. The Mirror will find it and lay out its two jobs: the hours a machine could already fill, the hours it can only speed up, the hours it cannot yet enter. In this first published version, the table is small and may at times run against your own memory of the work. Good. That is the model doing its job: task tables — the model's atoms — are an open invitation for contribution. Please reach out if you would like to contribute.
The next confident headline will arrive within the week. A new model that ends white-collar work, a robot that catches fire mid-air, a projected date for the economic collapse. Underneath it will be a capability claim dressed as an employment claim, or the reverse.
Two summers ago the machines couldn't count the letters in strawberry. This summer they touched mathematics that had resisted generations of hands and paper. That is one half of every job, moving. The other half held. Every job is two jobs — and it is worth knowing, precisely, which two are yours.
The dataset is open (CC BY 4.0) with the full methodology published. If a task table gets your job wrong, tell me — that is the most useful thing you can do with it.